Building an Internal Dashboard for Your Operations Team: A Complete Guide
Alex
··18 min read
Quick Answer: An internal dashboard for your operations team is a custom-built tool that replaces spreadsheets and manual tracking with real-time data visualization, automating reporting workflows and eliminating hours of weekly administrative work. For service businesses, this means your team sees project status, resource allocation, and client deliverables in one place—instantly—instead of hunting through email threads and outdated documents. The result: faster decision-making, fewer errors, and reclaimed productive hours.
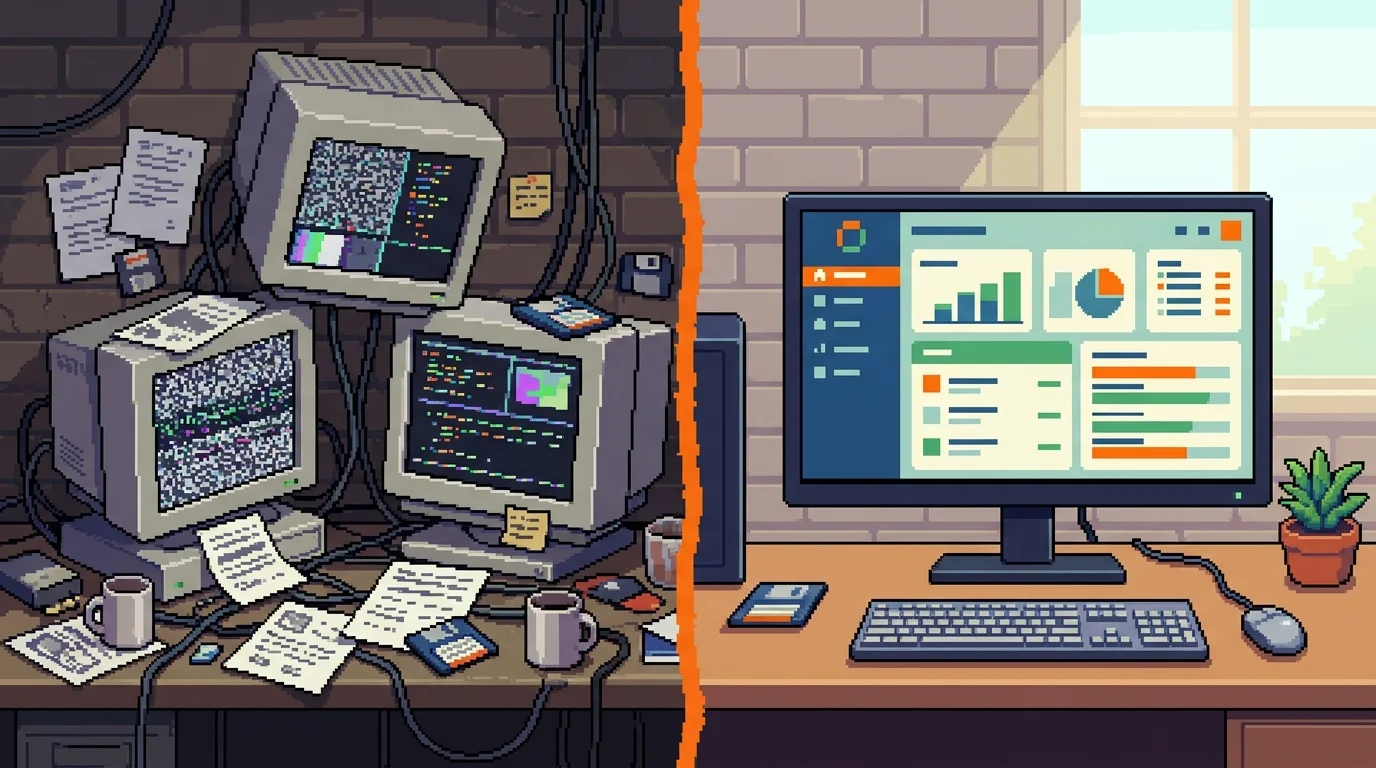
Building an internal dashboard for your operations team transforms how work actually gets done. Rather than piecing together information from email, Slack messages, and fragmented spreadsheets, your team accesses a single source of truth that updates automatically as projects move forward.
The math is straightforward. SMB managers spend an average of 12.4 hours per week on manual reporting tasks—roughly 30% of their productive work time—totaling 645 hours per year assembled into reports that could flow in real time. For a service business with five operations staff, that's over 3,200 hours annually spent on busywork instead of strategy, client relationships, or process improvement.
A purpose-built dashboard eliminates this friction entirely. Unlike generic spreadsheets or out-of-the-box software that forces your workflows into someone else's template, an internal app development approach lets you design exactly what your team needs: project timelines that sync with billing systems, resource utilization tracked against capacity, client deliverables flagged before deadlines slip. The dashboard becomes the operational nerve center—the place where decisions get made because the data is always current and always accurate.
This guide walks you through the complete process of designing, building, and deploying an internal dashboard that actually sticks. You'll learn how to replace spreadsheets with internal apps that scale alongside your business, what features matter most for operations teams, and how to avoid the common pitfalls that derail most dashboard projects.
Understanding Internal Dashboards: Core Features Every Operations Team Needs
An effective internal operations dashboard is fundamentally different from generic reporting software. It's a purpose-built tool that centralizes the metrics, workflows, and data your operations team actually uses to make decisions—not a one-size-fits-all template that forces you into someone else's process. For product development agencies and service businesses, this distinction matters enormously. Your dashboard should reflect how your team works: how projects move from specification through deployment, where bottlenecks occur, which clients are at risk of missing deadlines, and whether your team has capacity for new work.
The core value of a custom operations dashboard lies in eliminating the friction between data and action. Instead of waiting for someone to compile a weekly report from five different spreadsheets, your team sees real-time status updates the moment a project milestone changes. Instead of manually checking whether a resource is overallocated, the system flags conflicts automatically. This shift from reactive reporting to proactive visibility is what separates dashboards that actually get used from those that collect dust.
Real-Time Data Visibility and KPI Tracking
Real-time KPI tracking means your operations team always knows the current state of what matters most: project timelines, resource allocation, deadline risk, and team productivity. Rather than discovering problems in a Friday afternoon report, your team can spot a slipping deadline Tuesday morning and adjust accordingly. For service agencies, this typically means tracking billable hours against project budgets, monitoring which team members are at capacity, and flagging client deliverables that need attention before they become crises.
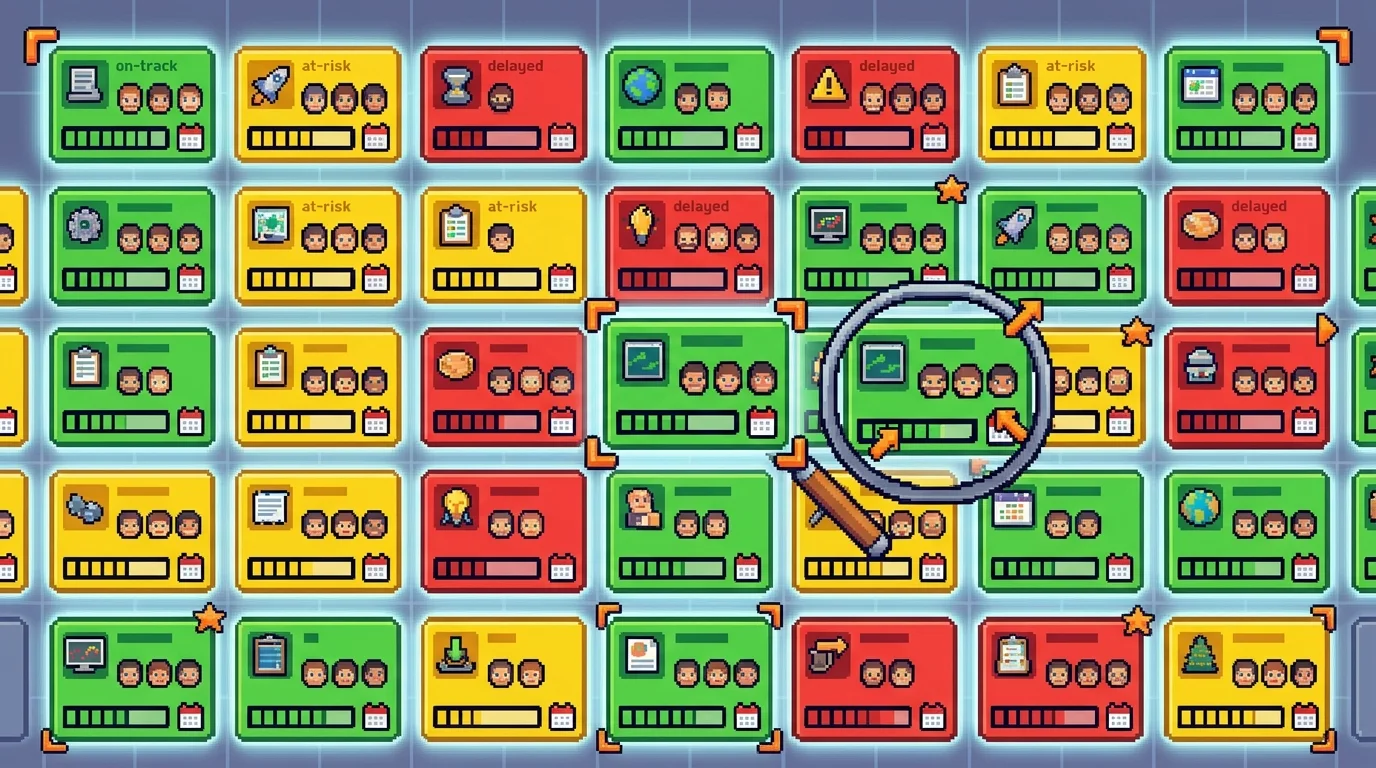
The power here is specificity. A generic dashboard shows "projects in progress"—useful, but vague. A custom dashboard for your agency shows which projects are on track, which are at risk, which client needs follow-up, and which team members should be reassigned to prevent overwork. You can drill down from a high-level view into granular details: not just "project X is 80% complete," but "project X is 80% complete, the design phase took 15% longer than estimated, and the next phase starts Thursday." This level of detail transforms data from informational to actionable.
Integrating project timelines with billing systems and resource allocation creates a unified view that spreadsheets simply cannot maintain. When a project timeline shifts, your billing forecast updates automatically. When a team member logs hours, capacity calculations adjust in real time. This interconnectedness is what allows your operations team to make confident decisions rather than educated guesses.
Automation and Workflow Integration
A custom workflow tool for your operations team automates the repetitive tasks that consume productive time without adding strategic value. Approvals that normally require email chains can trigger automatically based on predefined rules. Status updates that someone manually enters into five places now sync across all systems simultaneously. Notifications alert the right person at the right moment—not a daily digest of everything, but a targeted alert when action is needed.
According to research on automated performance dashboards, SMBs save 12+ hours weekly on reporting when they move from manual processes to automated systems. More critically, employees spend roughly 50% of their time correcting errors introduced during manual data entry. A custom back office software solution eliminates this entirely: data enters the system once, at the source, and flows everywhere it's needed without human intervention or transcription errors.
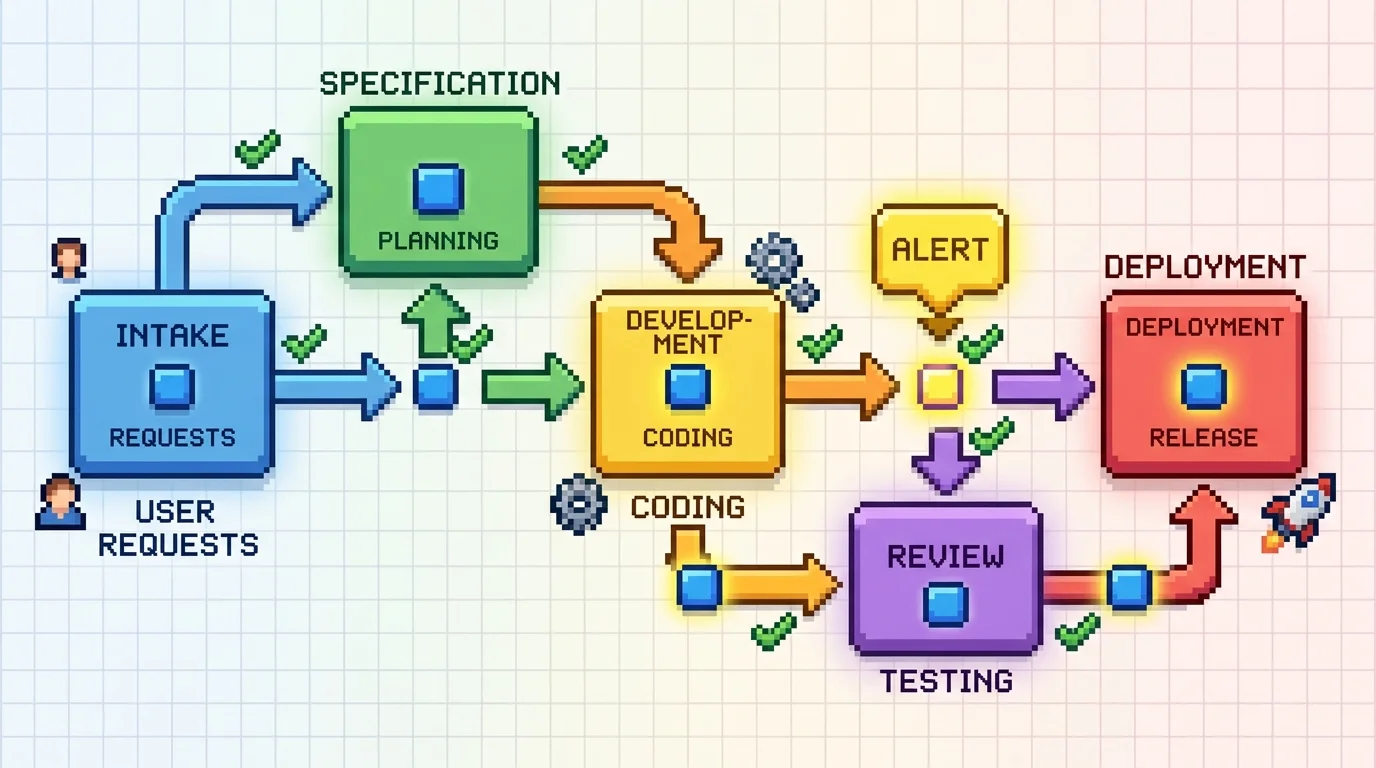
For product development agencies, this means automating handoffs between phases. When the specification phase is marked complete, the system can automatically notify the development team, create tasks in the build phase, and update the client timeline. When a developer marks code as ready for review, the system assigns it to the appropriate reviewer and tracks how long it sits in the queue. These small automations compound into hours of reclaimed time each week—time your team can spend on actual client value rather than administrative busywork.
Custom vs. Off-the-Shelf: Choosing the Right Approach for Your Team
The decision between building a custom internal dashboard and subscribing to an off-the-shelf SaaS platform isn't simply about upfront cost—it's about whether a generic solution can actually solve your specific operational problems. For product development agencies, this distinction matters enormously because your workflows are fundamentally different from those of a retail company, a marketing agency, or a manufacturing firm.
Off-the-shelf platforms like Tableau, Power BI, or Looker excel at one thing: displaying data that already exists in clean, standardized formats. They're excellent dashboards for visualizing sales pipelines, customer acquisition costs, or website traffic. But they assume your data is already organized. They don't know that your specification phase feeds into your build phase, which feeds into your deployment phase—each with its own approval gates, client notifications, and resource allocations. They don't understand that a developer's code review queue is a business metric that matters. They don't track the handoff from your project manager to your QA team as a critical moment where delays compound.
When you try to force a generic admin panel for startup MVPs or a standard business intelligence tool into an agency workflow, you end up creating workarounds. You build custom integrations. You write scripts to transform data. You maintain manual processes alongside the "automated" system. The tool becomes another thing to manage rather than a solution that eliminates management overhead.
When Custom Development Makes Financial Sense
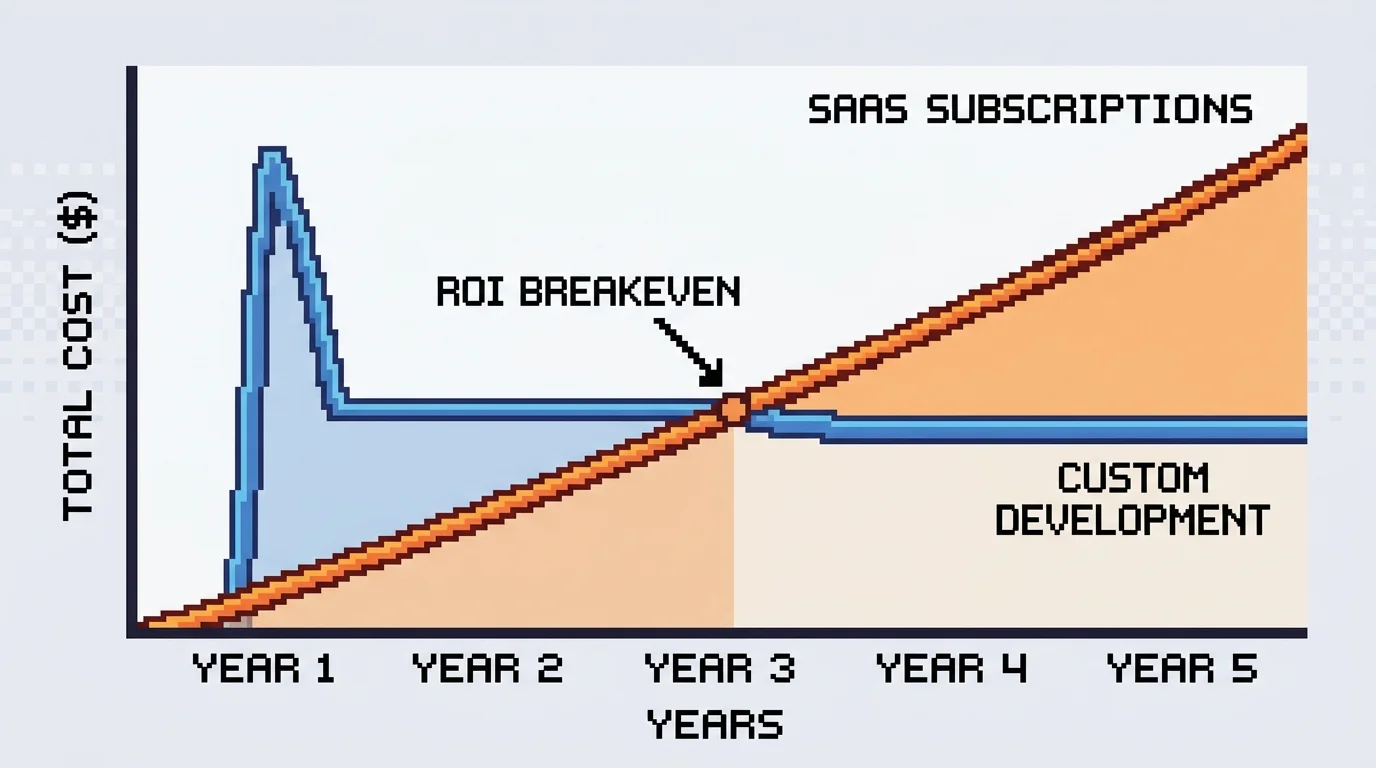
The financial case for custom development hinges on a simple calculation: total cost of ownership over five years. According to analysis comparing SaaS and custom software investments, total spending on SaaS subscriptions over five years typically exceeds initial custom development costs by 72%. For a team of ten people using Tableau at $70 per month or Power BI at $10 per user monthly, you're looking at $840–$1,200 annually in licensing alone. Over five years, that's $4,200–$6,000 per user in subscription costs.
Building a custom dashboard costs $10,000–$50,000 for initial development, depending on complexity. That sounds higher until you factor in what that custom tool actually delivers: zero licensing fees, complete ownership of your data and logic, and the ability to modify it as your business evolves without vendor lock-in or waiting for feature requests to be prioritized by a product team that doesn't know your agency.
But the real ROI isn't in licensing savings—it's in the operational efficiency that only a purpose-built system can deliver. When your specification-to-invoice workflow is automated, your team stops spending time manually updating spreadsheets, chasing down status updates, or correcting transcription errors. When your staff portal automatically shows available capacity, project managers stop overbooking resources. When client timelines update automatically as phases complete, you eliminate the daily email back-and-forth asking for status updates.
For agencies with unique workflows—quote-to-invoice tracking, job costing, multi-phase project management, staff utilization planning—a custom solution pays for itself within 12–18 months through reclaimed labor alone. After that, every year of operation is pure efficiency gain.
Best Tech Stack for Building Internal Tools Quickly
The barrier to custom development used to be time and complexity. Building a dashboard from scratch meant months of development. Today's rapid-development stacks have fundamentally changed that equation.
Low-code and no-code platforms reduce app development time by 50–90% compared to traditional coding, with 72% of low-code users completing full applications in under three months. Platforms like Retool, Budibase, or FlutterFlow allow you to build functional dashboards in weeks rather than months. They handle authentication, database connections, and UI components out of the box. You define your data sources, create views, add filters, and deploy—without writing backend code.
For agencies seeking faster time-to-value, API-first architectures paired with headless CMS approaches offer another path. Your operational data lives in a structured database (PostgreSQL, MongoDB), and your dashboard queries it directly through APIs. This approach scales better than low-code platforms as your complexity grows, and it gives you complete control over your data model. You're not constrained by a platform's pre-built assumptions about how dashboards should work.
The fastest path combines both: start with a low-code platform to validate your dashboard design and prove ROI within weeks, then migrate to a custom-built solution once you understand exactly what you need. This approach lets you launch fast while maintaining the option to scale into a fully custom system as your agency grows.
The choice ultimately comes down to this: if your operational workflow is standard, a SaaS platform works fine. If your workflow is unique to how you run your agency—and for most product development services, it is—a custom solution isn't a luxury. It's the only way to actually eliminate the manual work that's costing you hours every week.
Real-World Dashboard Solutions: Operations, Approvals, and Job Tracking
For product development agencies, generic dashboards don't work. Your workflows are too specific—project intake flows differently than client work, approvals happen at different gates, and team capacity constraints shift weekly. The dashboards that actually reduce manual work are built around how your agency actually operates, not how software vendors think you should operate.
Operations Dashboard: From Project Intake to Delivery
An operations dashboard for a service agency consolidates everything your team checks across five different tools into one screen. Active projects appear with their current status, deadline, assigned team members, and deliverables checklist. Resource allocation becomes visible instantly—you see which developers are at capacity, which are available for incoming work, and where bottlenecks exist. When a client asks for a status update, your project manager doesn't email three people. They pull the dashboard and answer in seconds.
The measurable outcome: reduced status-meeting overhead and faster client communication. Teams that move from email-based updates to a centralized operations view typically recover 4-6 hours per week of coordination time. You also catch delays earlier because visibility replaces guesswork. A developer falling behind on a deliverable becomes obvious on day two, not day nine.
The path from prospect inquiry to paid invoice is where most agencies lose hours to manual data entry and approval delays. A custom internal approvals app automates this entire cycle. A prospect request triggers a quote template pre-filled with standard rates and scope. Once the sales lead reviews and approves it, the system automatically creates a project record, assigns team members, and starts tracking billable hours. When work completes, invoicing happens with a single click—no manual line-item entry, no lost receipts.
This workflow app includes approval gates: quotes above a certain value require owner sign-off, change orders need client and project manager consent before work begins. Each approval is timestamped and logged, eliminating disputes about who approved what. Cash flow visibility improves dramatically because you know exactly when each project will invoice and when payment is expected. Agencies automating this workflow typically reduce quote-to-payment time from 30-45 days to 15-20 days, which directly improves cash reserves for reinvestment.
Job Tracking and Staff Portal: Keeping Teams Aligned
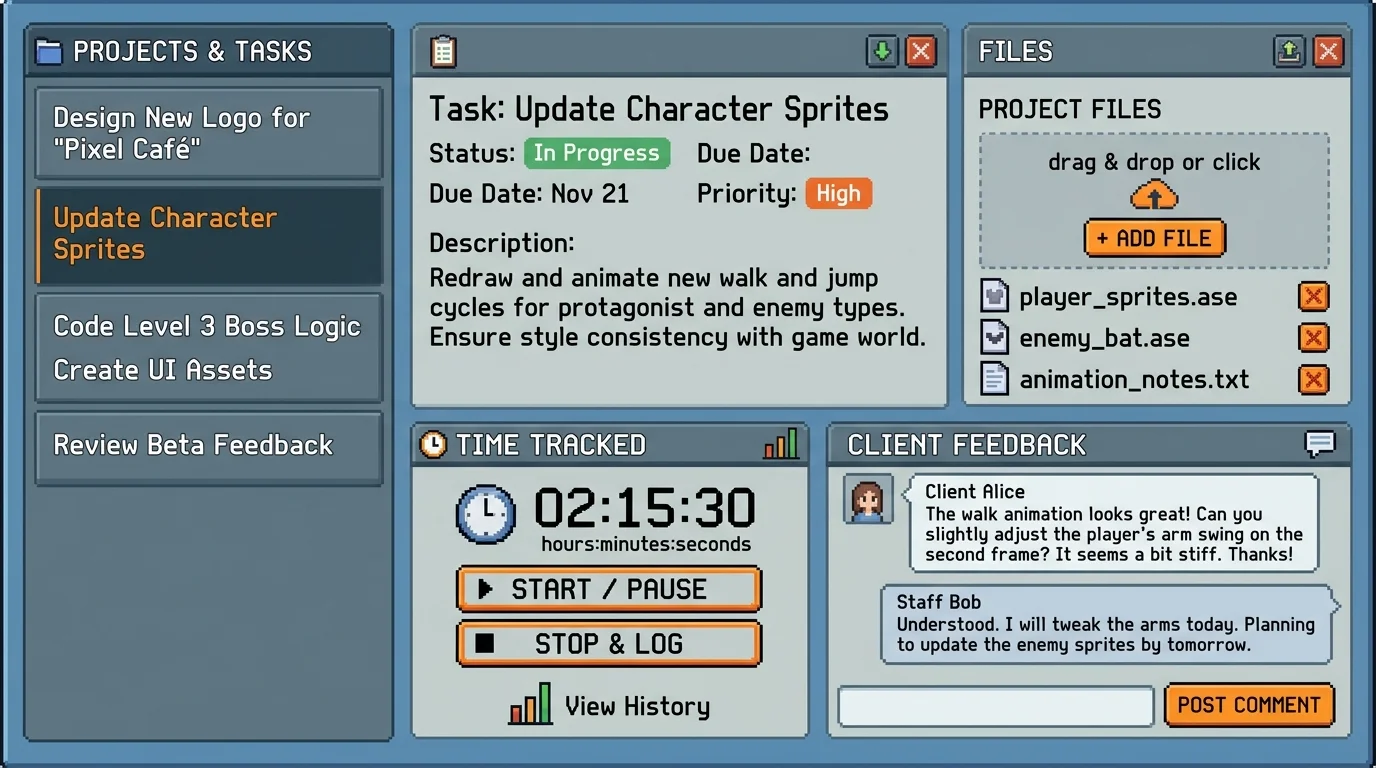
Service delivery teams drown in fragmented communication—tasks in Asana, time tracking in another tool, deliverables discussed in Slack, client feedback in email. A staff portal centralizes this chaos. Team members log in to see their assigned tasks, track time against billable codes, upload completed work, and view client feedback without context-switching between apps. Managers see real-time progress across all active jobs and can reassign work instantly when priorities shift.
The staff portal also serves as a single source of truth for what's actually happening on a project. Unlike email threads that disappear or Slack messages that scroll away, all work history lives in one place. When a client questions a deliverable, you pull the portal record showing exactly when it was completed, who reviewed it, and what feedback was provided. This reduces disputes and creates accountability. Teams using centralized job tracking report 15-20% faster project completion because coordination overhead drops and context-switching ends. For agencies operating on tight margins, that efficiency directly impacts profitability.
Building Your Dashboard: The Development Process and Timeline
Building a production-ready internal dashboard doesn't require months of planning or a massive engineering team. The right approach—combining clear requirements upfront with modern development practices—lets you move from concept to live operations in as little as four weeks. Understanding this process removes the mystery and helps you avoid the common pitfall of endless revisions that derail timelines.
Phase 1: Define Your Dashboard Requirements
Before a single line of code is written, you need to document exactly what your operations team actually does and where they struggle. This phase determines everything downstream. Start by mapping your current workflows: How do managers track project status? Where do they spend time switching between tools? What decisions require data they can't access quickly?
Document your team's pain points with specificity. Don't just say "reporting is slow"—identify that your project manager spends 90 minutes every Monday compiling status updates from email, Slack, and three different spreadsheets. That concrete detail becomes a feature: a dashboard that auto-aggregates status from all active projects in one view.
Next, define the KPIs and metrics your team actually needs to see. Operations dashboards live or die based on whether they surface the right data. For a service agency, this might be billable hours tracked against project budgets, client deliverable status, team capacity utilization, or cash flow visibility. For a SaaS operations team, it could be user onboarding completion rates, churn by cohort, or support ticket resolution time.
Identify your user roles and what each person needs to see. A project manager needs different visibility than a team member or an executive. Role-based access isn't just a security feature—it's essential for dashboard usability. Finally, list every system your dashboard needs to connect to: your billing platform, project management tool, time tracking software, payment processor, or custom database. These integrations determine complexity and timeline far more than the dashboard interface itself.
Phase 2: Design and Prototype
Wireframing and rapid prototyping save months of wasted development. A clickable prototype lets your team interact with the dashboard layout before developers write backend logic. This catches misunderstandings early—when changes cost hours, not weeks.
Start with low-fidelity sketches: Where should the main metrics live? Should team members see a task list or a calendar view? What actions should be one click versus buried in a menu? Use tools like Figma or even paper sketches to explore these questions. The goal isn't polish; it's clarity.
Then move to user testing with your actual operations team. Show them the prototype and watch where they click. Do they instinctively look for a search box? Do they expect to filter by client or by team member first? Their behavior reveals what mental model they're already using, and your dashboard should match that, not fight it.
This phase typically takes one to two weeks but prevents the costly rework that happens when developers build based on vague requirements. A prototype also serves as your specification document—developers know exactly what to build because they can see it and interact with it.
Phase 3: Rapid Development and Deployment
Modern development practices and pre-built components enable fast delivery without sacrificing code quality or your ownership of the final product. Rather than building everything from scratch, experienced teams use proven patterns: authentication libraries for user management, payment SDKs for billing integration, and component libraries for the UI.
The development phase for operations dashboard development typically spans two to three weeks for a fully functional system with integrated payments, user management, and business logic. Your team works in short cycles—building core features first, testing them with real data, then adding refinements. This iterative approach means you're never far from a working version, even if priorities shift mid-project.
Testing happens continuously, not as an afterthought. By the time you're ready to deploy, the dashboard has been validated against real workflows and real data. Deployment itself is straightforward: the system goes live, your team starts using it, and you own the code and infrastructure from day one. There's no vendor lock-in, no monthly SaaS fees for a tool that doesn't quite fit your process.
When you partner with a development team experienced in building internal tools for startups and agencies, this entire process—from requirements to production—compresses significantly. The difference between a six-month project and a four-week delivery isn't magic; it's the difference between starting from scratch and applying proven patterns to your specific problem.
Key Metrics and Success Indicators for Your Operations Dashboard
Success after deploying an internal dashboard isn't just about having sleek visuals—it's measurable impact on efficiency, accuracy, and team confidence. When you build an internal tool for a startup, the real return comes from time reclaimed, errors prevented, and decisions accelerated. Track these key indicators to quantify value and justify the investment.
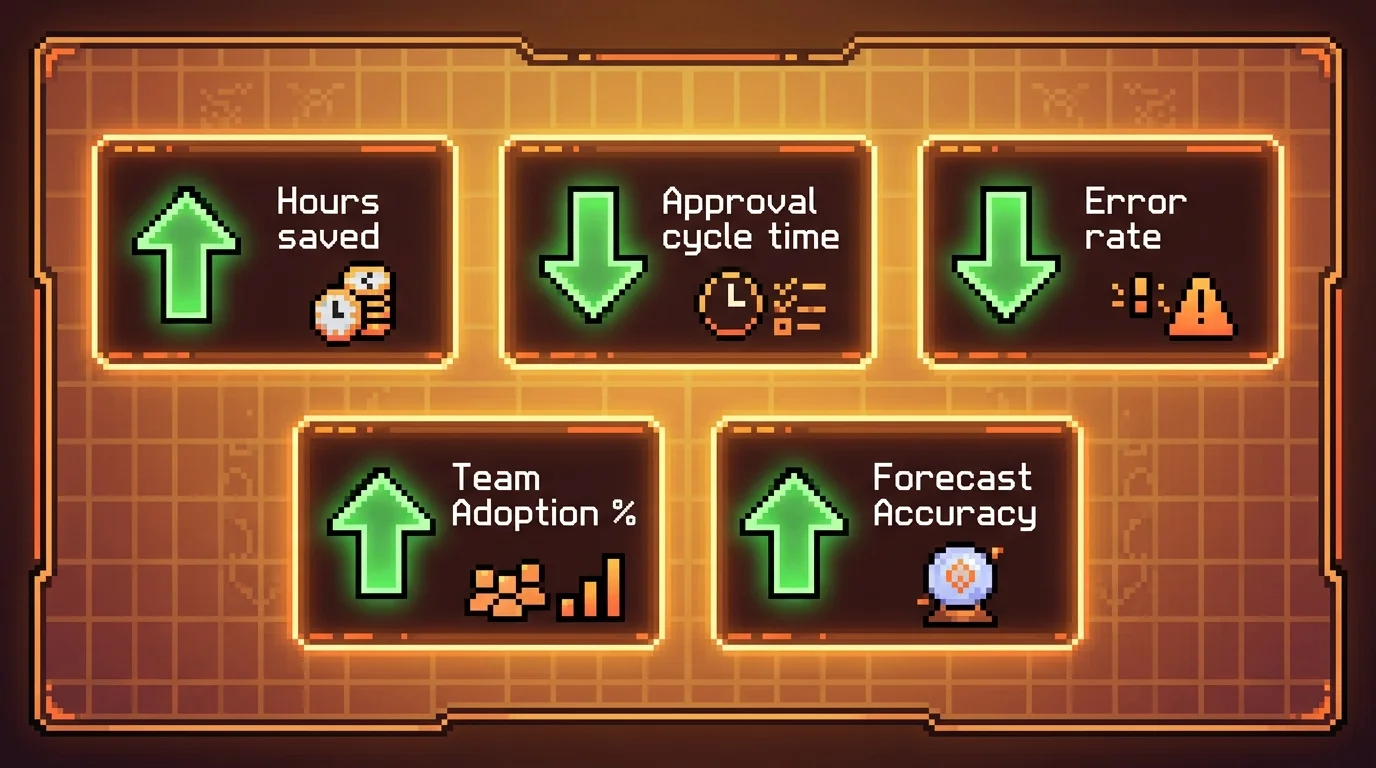
Time saved per team member per week: Automating manual reporting and data entry typically frees 5–10 hours weekly. This time shifts from reactive tracking to proactive problem-solving.
Reduction in approval cycle time: Streamlined workflows with real-time notifications cut approval lag from days to hours, accelerating project momentum.
Error rate decrease: Automated validations and centralized data reduce human error by up to 70%, minimizing costly rework and miscommunication.
Team satisfaction and adoption rate: High usage and positive feedback signal that the tool fits real workflows. Aim for 90%+ active adoption within 60 days.
Project visibility and status accuracy: Real-time dashboards eliminate status update meetings. Teams report a 40% improvement in forecasting accuracy post-deployment.
According to Salesforce 2025 Small Business Trends Report, automated performance dashboards deliver a median ROI of 340% in the first year, with payback periods averaging just 2.3 months. These outcomes reflect not just cost savings, but operational maturity. For founders navigating the path of building internal tools for startups, focusing on these metrics ensures the dashboard becomes a strategic asset—not just another software project.
Moving Forward: From Spreadsheets to a Purpose-Built Operations Dashboard
The shift from spreadsheets to a purpose-built operations dashboard isn't a luxury upgrade—it's a competitive necessity for service agencies that want to scale without drowning in manual work. Every day your team spends hunting for status updates, reconciling conflicting data sources, or chasing approvals is a day you're not shipping value to clients or growing the business.
The good news: building a production-ready dashboard is faster and more affordable than it's ever been. What once required a six-month engineering project and a six-figure budget can now be delivered in weeks at a fraction of the cost, especially when you partner with teams that specialize in custom operations tools. You're not paying for bloated enterprise software or learning curves—you're getting a tool built specifically for how your team actually works.
The metrics speak for themselves. Real-time visibility eliminates status meetings. Automated workflows compress approval cycles from days to hours. Error reduction through validation catches problems before they cascade. And when your team adopts the tool at 90%+ within two months, you know you've solved a real problem, not created another software burden.
If spreadsheets are slowing your agency down, or if you're managing approvals and job tracking through email threads and Slack, the path forward is clear. Building internal tools for startups follows the same principles as any product launch—understand the pain, design for the user, and ship something that works. The difference is that your users are sitting right next to you.
Ready to explore what a custom operations dashboard could do for your team? Let's talk about what's possible.
Article FAQ
Practical next steps
Who is this startup guide for?
This guide is written for non-technical founders, operators, and small teams who need to make product decisions before hiring a full engineering team. It focuses on practical scope, cost, timeline, and execution trade-offs rather than abstract startup theory.
What should I do after reading this article?
Turn the idea into a small decision: validate the riskiest assumption, estimate the build scope, and decide whether the first version should be no-code, custom code, or a hybrid. Shipkit's free estimate and MVP scope builder can help you translate the article into a concrete plan.
Can Shipkit help implement this kind of product?
Yes. Shipkit helps founders turn validated ideas into fixed-scope MVPs, SaaS products, internal tools, marketplaces, and AI-enabled workflows. The best starting point is to get an estimate or compare your build path before committing budget.